Herasight vs Nucleus: what our 2025 analysis found
In 2025, Herasight examined five Nucleus physician reports supplied with customer consent and dated through June of that year. Our analysis found that the performance implied by several reported risk estimates was higher than the performance we measured when validating the best-matched publicly available scores.
These were adult reports, not embryo reports. At the time, we had not found public information establishing that Nucleus used a different predictor set for its embryo service. That distinction matters: our analysis directly tested the scores reconstructed from those reports.
Nucleus has since published newer models and validation material, including its current Labs page and a September 2026 traits whitepaper. The analysis below concerns the earlier reports; it does not retest those newer models. For families evaluating either provider today, the relevant question is how the exact model used in their report has been validated.
What we found in the 2025 reports
During that assessment, we discovered multiple inconsistencies in the reports, including an apparently consistent and substantial overstatement of the predictive validity of the scores being used. Here we cover the main findings. The Supplementary Note in our 2025 whitepaper explains the reconstruction and validation methods.
Which scores were used?
Our evaluation showed considerable variability in the composition of the polygenic scores (PGSs) in those reports. Nine of the disease PGSs appeared to be open-source models from the PGS catalog, a repository where researchers make pre-trained scores available. Almost all were from studies already at least five years old when we conducted the analysis. Other disease predictions relied on variant sets notably smaller than typically required to adequately capture polygenic signals.
For example, the polygenic score for attention-deficit hyper-activity disorder (ADHD) reportedly consisted of 12 variants, and a Parkinson’s disease score contained 50 variants. These variant counts fall substantially below conventional benchmarks for using PGSs to predict highly polygenic traits.
Most of the scores also appeared identical to scores used by Nucleus’s open-source precursor, Impute.me. That suggested limited updates between the project's inception as a for-profit business in 2022 (source note 17) and the reports we examined in 2025, despite the commitment to current predictive scores quoted in our analysis (source note 18).
What performance did the reports imply?
We sought to validate the performance implied by those reports for scores we could identify in the scientific literature and reconstruct from publicly available weights. We converted the reported risks to a measure called liability-scale R², which estimates how much variation in an underlying susceptibility to disease a score explains. It is not the percentage of patients correctly diagnosed. We then compared those implied values with the values we measured when independently validating the same scores in the UK Biobank, a population-scale dataset containing genetic and health information on nearly half a million Britons.
The basic idea here is that from the individual physicians’ reports that we analyzed, given the individual risk predictions (PGS Z-scores, reported absolute risk) and the baseline population prevalences reported, it is possible to back-calculate the implied liability R² of their scores, as they are mathematical transformations of each other.
Across the five customer reports, we noted substantial variability in the implied predictive performance, with, for example, schizophrenia having an implied liability R² ranging from 0.0 to 0.05.
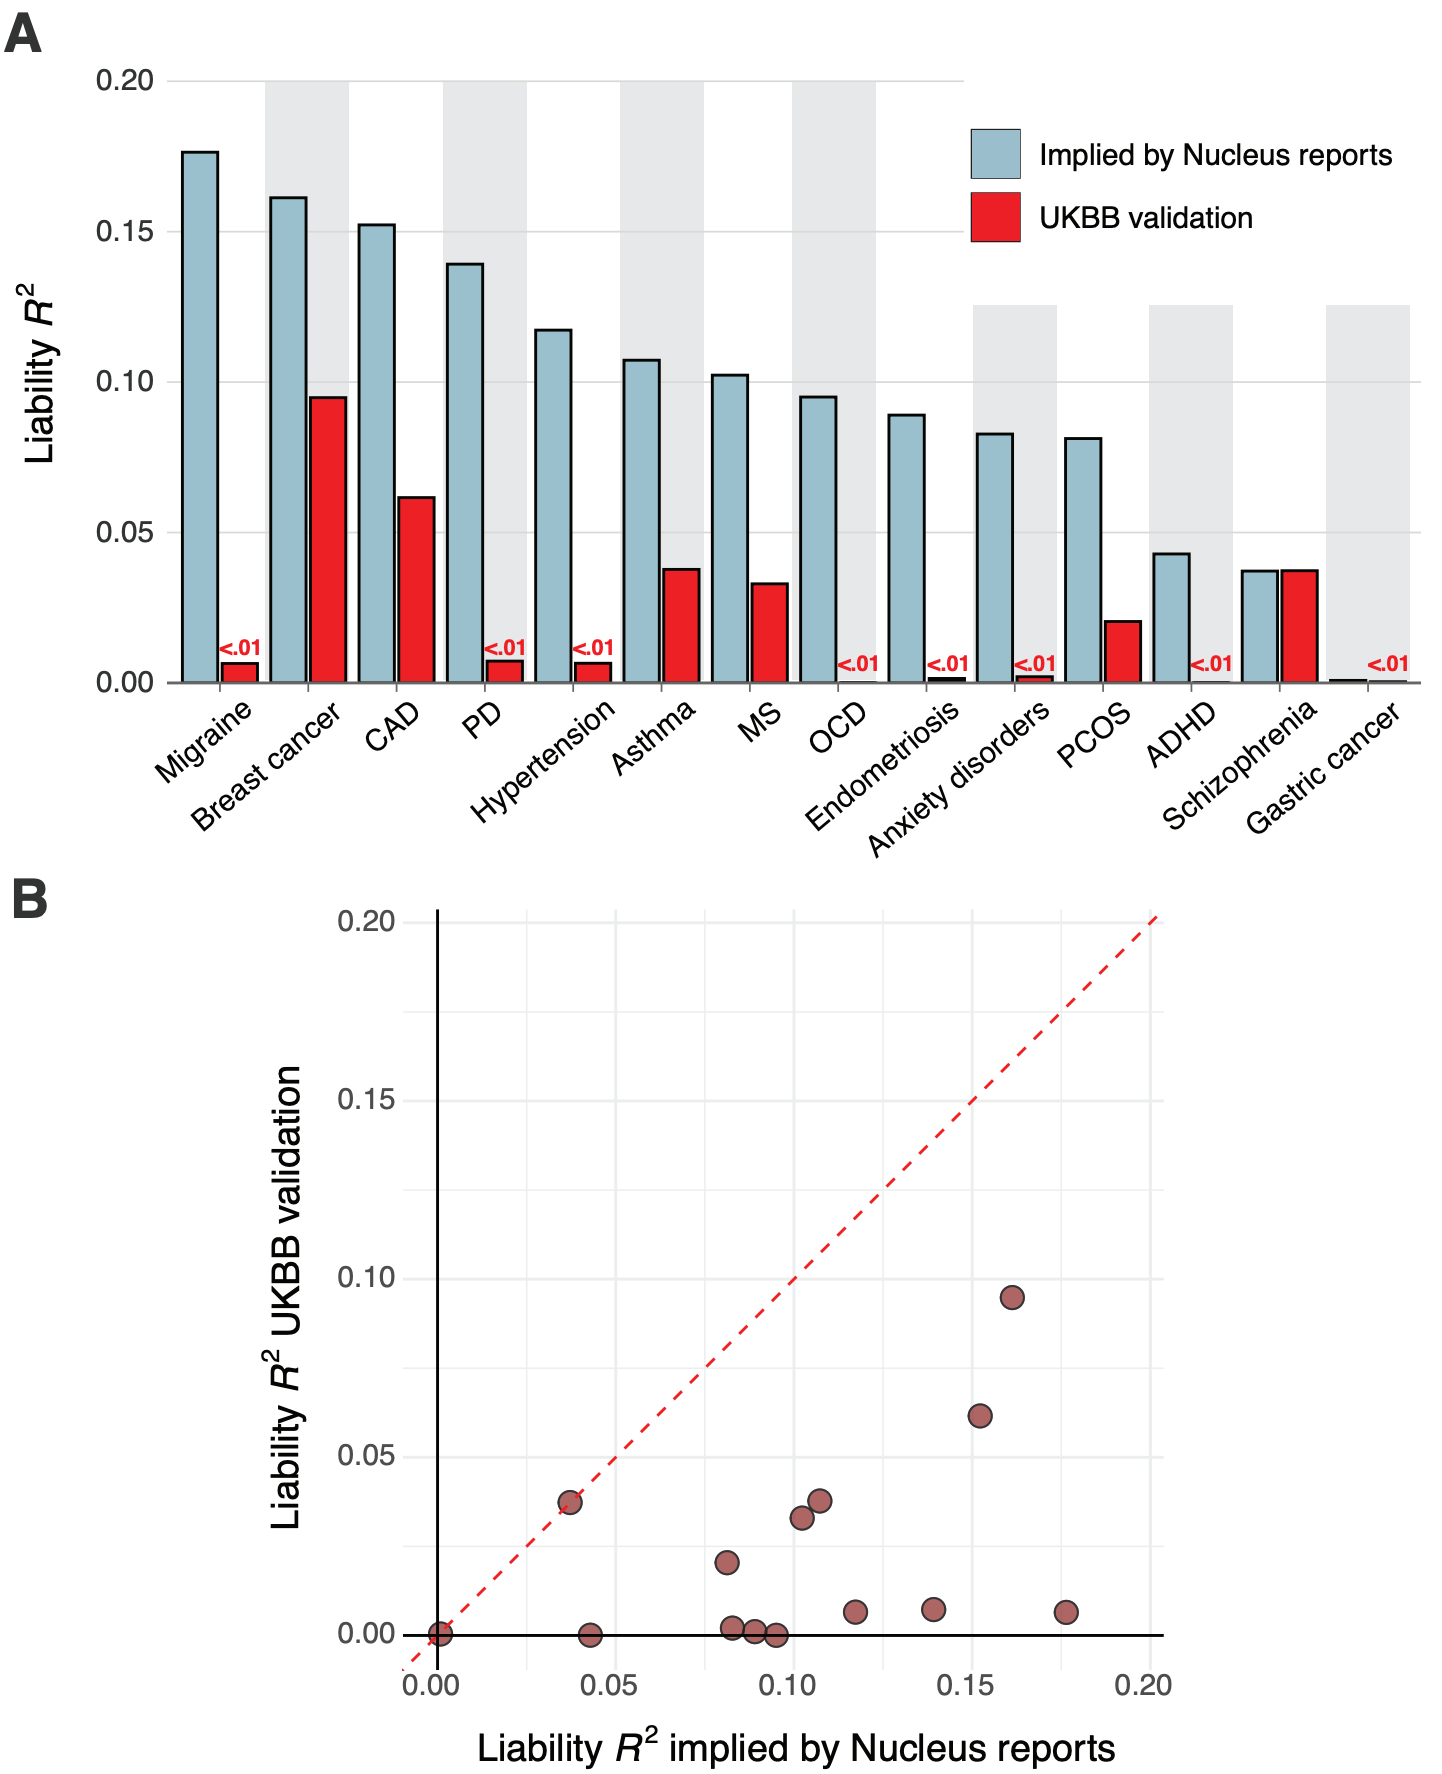
We found that for nearly all diseases, the median implied performance derived from those reports was consistently — and often substantially — higher than our independently validated performance estimates. Figure 1 compares the liability R² values implied by the reports with the values from our independent validation.
Notably, we found literature-based performance estimates for the breast cancer (source note 19) and schizophrenia (source note 20) PGSs, and these were highly concordant with those from our own validation in the UK Biobank. This concordance suggests that our independent validations are consistent with externally conducted validations. Overall, the PGSs likely used in the reports we examined showed substantially lower predictive performance than the reports implied, raising questions about those reported risk estimates.
An Example: Nucleus’s ADHD Score
In the 2025 physician reports we assessed, Nucleus described a two-part analysis for ADHD. Our assessment raised methodological concerns about both parts.
The first part examined the exome, listing 13 genes as relevant for ADHD: AUTS2, CRY1, FGD1, FOXP1, MBD5, MTNR1A, NAA15, NF1, NRXN1, SCN1A, SETBP1, SLC6A3, and SLC9A9. The reports did not explain why this particular set was selected. The list also omitted genes highlighted by research available at the time, including KDM5B (source note 21).
The polygenic score in those reports raised a separate concern. Nucleus stated that it analyzed 12 single nucleotide polymorphisms (SNPs), which correspond to the genome-wide significant "hits" identified in the 2019 Demontis et al. genome-wide association study (source note 22). This "top hits" approach represents an outdated methodology. While these 12 variants have the strongest individual statistical link to ADHD, modern genetic science has demonstrated that they capture only a tiny fraction of the heritability for a highly polygenic trait like ADHD — indeed, per Demontis et al., “the 12 significant loci are compelling, but only capture a tiny fraction of common variant risk for ADHD.” Within the paper, Demontis et al. themselves rely on tens of thousands of variants to build a polygenic score, as true polygenic prediction works by aggregating the small effects from thousands, or even millions, of variants across the entire genome. Relying only on the strongest hits ignores the vast majority of the genetic information that determines an individual's risk.
The choice of the 2019 study was also questionable by 2025. A much larger follow-up study by the same group had been published in 2023 (source note 23). The 2019 data appeared to be a legacy of Impute.me; the reports we examined did not appear to incorporate the newer study.
Given this background, we were surprised that the predictions in the reports implied that the model explained 4% or more of the variation in ADHD risk for customers of European ancestry. We considered that implausible for a 12-SNP model: it exceeded the roughly 1% benchmark from models using millions of variants cited in our 2025 analysis (source note 24).
When we reconstructed that 12-SNP model and tested it in the UK Biobank, we did not detect predictive performance distinguishable from chance. That result did not substantiate the much larger predictive performance implied by the reports. A non-significant result does not, by itself, prove that a predictor has exactly zero predictive value.
Planning your testing with Herasight
At Herasight, we publish our methods and validation results so families and clinicians can examine the evidence. Our disease-score research includes analyses within families and across ancestry groups. The relevant evidence and limitations depend on the condition and the model being considered.
Book a consultation with Herasight. Bring any existing PGT-A results and relevant clinical genetics reports. We'll help you establish which tests can answer your questions, whether your existing data are suitable, and what your testing plan would cost.